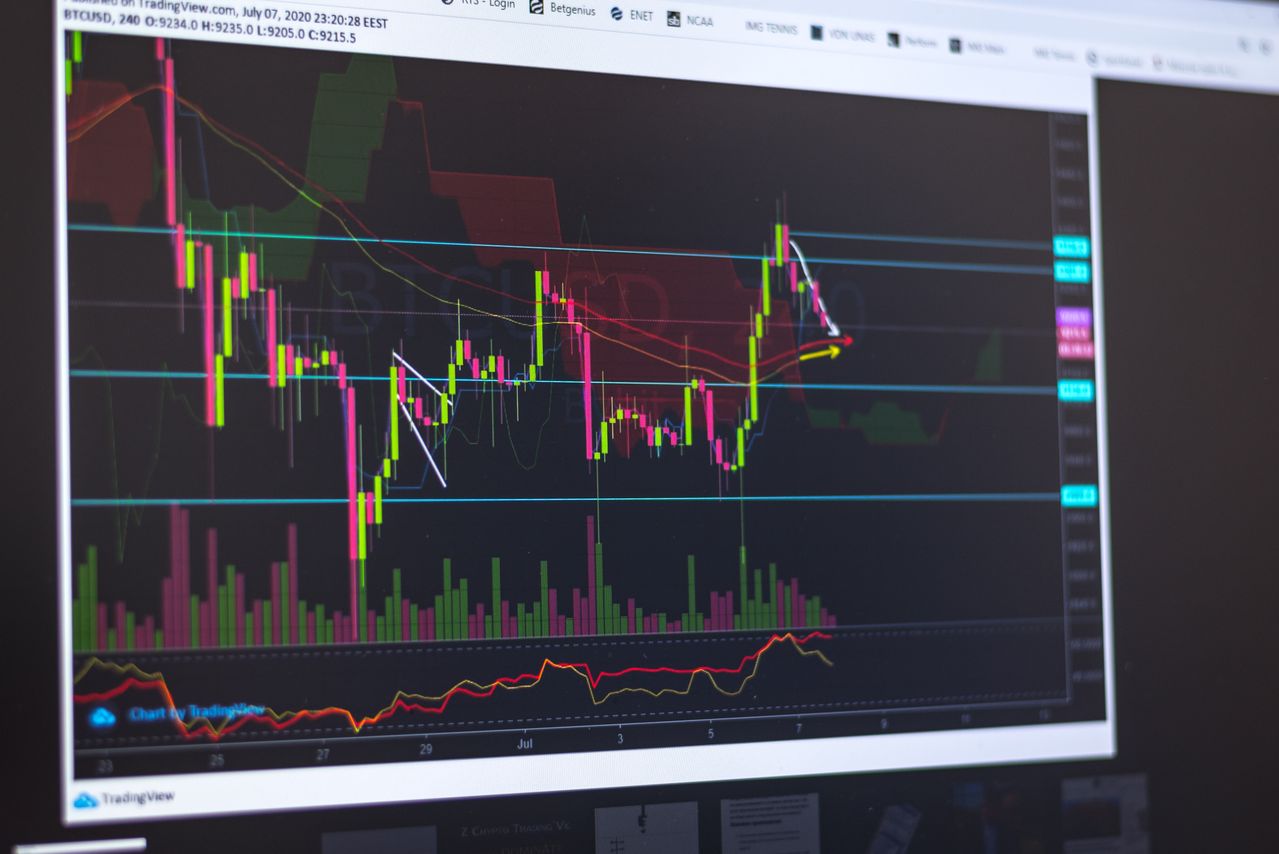
The Relative Strength Index (RSI) is one of the most popular and beginner-friendly technical indicators used in Forex trading. It helps traders measure the strength of recent price movements and identify when a currency pair may be overbought or oversold.
Unlike moving averages, which focus on trend direction, or the MACD, which measures trend and momentum, the RSI is primarily a momentum oscillator. It provides insight into whether buyers or sellers are becoming exhausted, helping traders spot potential reversals and confirm trading opportunities.
In this beginner’s guide, we’ll explain what the RSI is, how it works, why traders use it, and how you can incorporate it into your Forex trading strategy.
What Is the RSI Indicator?
The Relative Strength Index (RSI) is a momentum indicator that measures the speed and magnitude of recent price changes.
The RSI is displayed as a line that moves between 0 and 100.
Rather than following the price itself, the RSI measures the strength of recent buying and selling pressure.
When buying pressure becomes unusually strong, the RSI rises.
When selling pressure dominates, the RSI falls.
This allows traders to identify when a market may be becoming overextended in one direction.
The RSI was developed by technical analyst J. Welles Wilder Jr. in 1978 and has remained one of the most widely used indicators in financial markets ever since.
Why Is the RSI Useful?
Markets rarely move in a straight line.
Even in strong trends, prices pause, pull back, or reverse.
The RSI helps traders understand whether the current momentum is becoming unusually strong or weak.
It is useful because it can help traders:
- Measure market momentum
- Identify overbought conditions
- Identify oversold conditions
- Spot potential trend reversals
- Confirm trading signals
- Detect divergence between price and momentum
Rather than predicting exactly when prices will reverse, the RSI highlights areas where a reversal becomes more likely.
How Does the RSI Work?
The RSI compares the average gains and average losses over a chosen period.
The most commonly used setting is 14 periods, meaning the RSI analyses the previous 14 candles.
Fortunately, you don’t need to calculate the RSI yourself—your trading platform performs the calculations automatically.
The result is a value between 0 and 100.
Generally speaking:
- An RSI reading above 70 suggests the market may be overbought.
- An RSI reading below 30 suggests the market may be oversold.
These levels help traders assess whether buying or selling momentum has become excessive.
Understanding the RSI Scale
The RSI moves continuously between 0 and 100.
Each area of the scale provides different information about market momentum.
Above 70 – Overbought
When the RSI rises above 70, buying pressure has been particularly strong.
This doesn’t necessarily mean the market will immediately fall.
Instead, it suggests prices may have risen too quickly and buyers could be losing momentum.
Some traders begin looking for signs of a potential reversal or pullback when the RSI enters this zone.
Below 30 – Oversold
When the RSI falls below 30, selling pressure has been unusually strong.
Again, this doesn’t guarantee prices will rise immediately.
However, it indicates that sellers may be becoming exhausted and buyers could soon regain control.
Many traders look for buying opportunities if other technical signals support the move.
Between 30 and 70
Most of the time, the RSI remains between 30 and 70.
This usually indicates relatively balanced market conditions.
During strong trends, the RSI may spend extended periods above 70 or below 30 without a significant reversal occurring.
This is why the RSI should never be used on its own.
How Traders Use the RSI
There are several ways traders use the RSI in Forex trading.
1. Identifying Overbought Markets
One of the most common uses of the RSI is identifying overbought conditions.
If the RSI rises above 70, it suggests buying momentum has become particularly strong.
Some traders begin watching for:
- Bearish candlestick patterns
- Resistance levels
- Trendline breaks
- Confirmation from other indicators
If multiple signals align, traders may consider a potential selling opportunity.
It’s important to remember that “overbought” does not mean the market must fall immediately. Strong trends can remain overbought for extended periods.
2. Identifying Oversold Markets
Similarly, an RSI below 30 suggests the market may be oversold.
This indicates selling pressure has become unusually strong.
Rather than buying immediately, experienced traders often wait for confirmation, such as:
- Bullish candlestick patterns
- Support levels
- Trendline breaks
- Other momentum signals
Confirmation helps reduce the risk of entering a trade too early.
3. RSI Divergence
One of the RSI’s most powerful features is its ability to identify divergence.
Divergence occurs when price and the RSI move in opposite directions.
Bullish Divergence
Price makes lower lows.
The RSI makes higher lows.
This suggests selling momentum is weakening and buyers may soon take control.
A bullish reversal could become more likely if additional confirmation appears.
Bearish Divergence
Price makes higher highs.
The RSI makes lower highs.
This indicates buying momentum is fading.
Although prices are still rising, buyers may be losing strength, increasing the possibility of a bearish reversal.
Divergence is often considered one of the strongest RSI signals but should always be confirmed using price action.
4. Confirming Trends
Although the RSI is best known for identifying overbought and oversold conditions, it can also help confirm trends.
During strong uptrends:
- The RSI often remains above 50.
- Pullbacks may stop around the 40–50 area before moving higher again.
During strong downtrends:
- The RSI often remains below 50.
- Rallies may struggle to rise above the 50–60 area before falling again.
Many experienced traders pay close attention to the 50 level because it often reflects the balance between buyers and sellers.
A Simple Beginner RSI Strategy
One straightforward way to use the RSI is to combine it with the overall market trend.
Buy Setup
- Price is above the 50-period moving average.
- The RSI falls below 30.
- The RSI then rises back above 30.
- A bullish candlestick pattern appears.
- Consider a buy trade if the overall trend remains bullish.
Sell Setup
- Price is below the 50-period moving average.
- The RSI rises above 70.
- The RSI then falls back below 70.
- A bearish candlestick pattern appears.
- Consider a sell trade if the downtrend remains intact.
Waiting for the RSI to move back out of the overbought or oversold zone helps confirm that momentum may be changing.
Adjusting RSI Settings
The default RSI setting is 14 periods, and this works well for most traders.
However, some traders adjust the settings depending on their trading style.
Shorter Settings (7–9)
- Faster signals
- More sensitive to price changes
- Generates more trading opportunities
- Produces more false signals
Standard Setting (14)
- Balanced approach
- Suitable for most beginners
- Widely used across financial markets
Longer Settings (21–28)
- Smoother signals
- Fewer false signals
- Better suited for long-term trading
- Slower to react
Beginners are generally advised to start with the standard 14-period RSI before experimenting with other settings.
Advantages of the RSI
The RSI has remained popular for decades because it offers several important benefits.
It is:
- Easy to understand
- Simple to use
- Suitable for beginners
- Excellent for measuring momentum
- Helpful in identifying overbought and oversold markets
- Effective at spotting divergence
- Compatible with all Forex currency pairs
- Useful across multiple timeframes
Its versatility makes it one of the first indicators many traders learn.
Limitations of the RSI
Although the RSI is a valuable tool, it has limitations.
One common mistake beginners make is assuming that an overbought market must fall or an oversold market must rise.
In reality, strong trends can remain overbought or oversold for a long time.
Other limitations include:
- False signals during strong trends
- Frequent reversals in ranging markets
- Divergence can appear long before price actually reverses
- It cannot predict future price movements
This is why the RSI works best when combined with other forms of technical analysis rather than being used as a standalone indicator.
Tips for Beginners
If you’re new to using the RSI, keep these tips in mind:
- Start with the standard 14-period setting.
- Don’t buy simply because the RSI falls below 30 or sell simply because it rises above 70.
- Always look for confirmation from price action or other indicators.
- Trade in the direction of the overall trend whenever possible.
- Practise using the RSI on a demo account before risking real money.
Learning to interpret the RSI within the context of the broader market will improve your decision-making over time.
RSI vs. MACD
Both the RSI and the MACD measure momentum, but they do so in different ways.
The RSI measures the speed and strength of recent price movements, making it particularly useful for identifying overbought and oversold conditions.
The MACD, on the other hand, measures the relationship between two moving averages. It is generally better suited for identifying trend direction and changes in momentum.
Many traders use both indicators together. For example, the MACD can be used to confirm the trend, while the RSI helps identify high-probability entry points when momentum begins to shift.
Conclusion
The Relative Strength Index is one of the most effective and widely used momentum indicators in Forex trading. By measuring the strength of recent price movements, it helps traders identify overbought and oversold conditions, confirm trends, and recognise potential market reversals.
For beginners, the RSI provides an excellent introduction to momentum analysis because it is simple to understand, easy to interpret, and available on virtually every trading platform. Whether you’re using it to spot divergence, confirm trends, or identify potential turning points, the RSI can become a valuable addition to your trading toolkit.
Like all technical indicators, however, the RSI is not a crystal ball. It cannot predict future price movements with certainty, and it works best when combined with other tools such as moving averages, support and resistance, candlestick patterns, and sound risk management. Used as part of a well-rounded trading strategy, the RSI can help traders make more informed and disciplined decisions in the Forex market.
Leave a Reply
You must be logged in to post a comment.