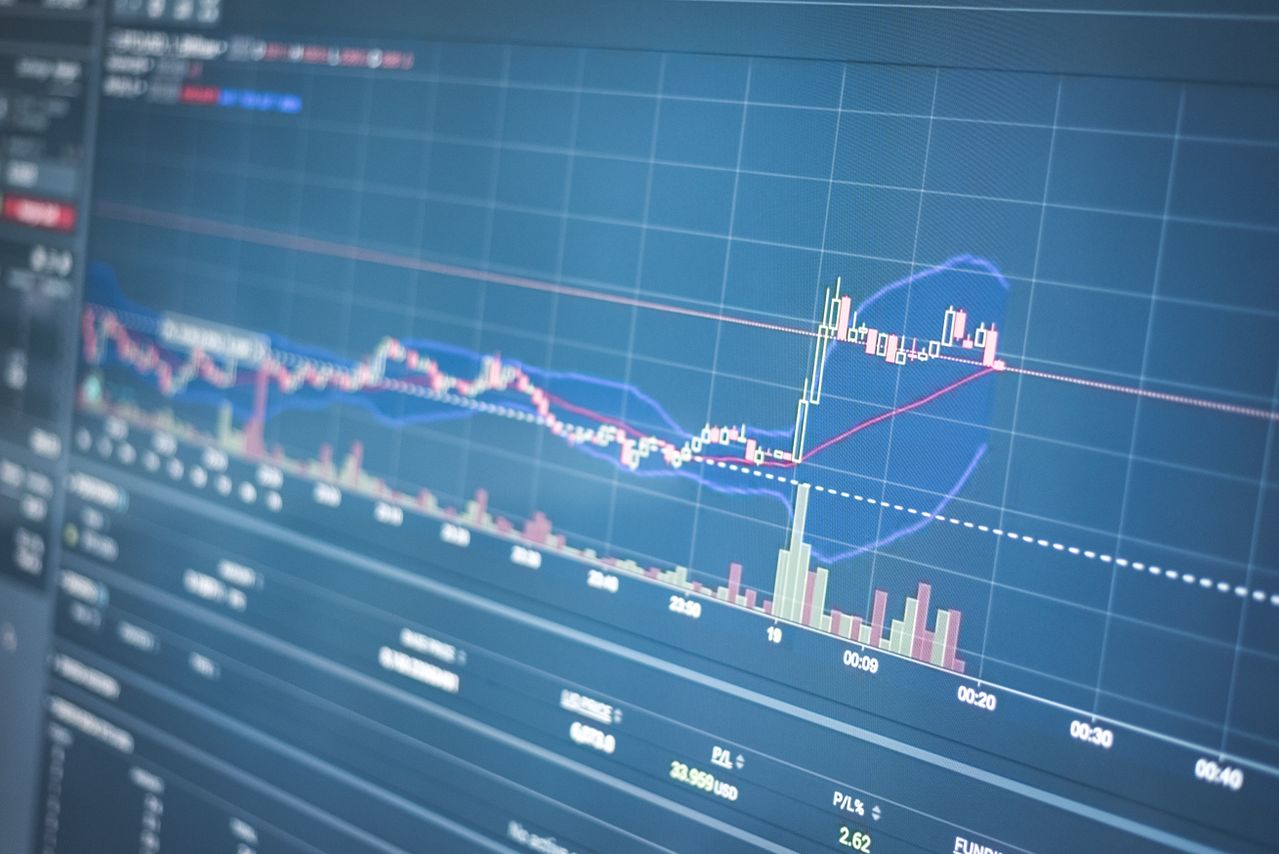
If you’ve started exploring technical analysis in Forex trading, you’ve probably come across Bollinger Bands. They are one of the most widely used indicators for measuring market volatility and identifying potential trading opportunities.
Unlike moving averages, which primarily show the direction of a trend, or the RSI, which measures momentum, Bollinger Bands help traders understand how volatile the market is and whether prices are trading at relatively high or low levels.
The indicator is popular because it’s easy to interpret and can be used in both trending and ranging markets. However, like any technical tool, it’s most effective when combined with other forms of analysis.
In this beginner-friendly guide, we’ll explain what Bollinger Bands are, how they work, why traders use them, and how you can incorporate them into your own Forex trading strategy.
What Are Bollinger Bands?
Bollinger Bands are a technical indicator that consists of three lines plotted directly on your price chart.
These three lines are:
- The Middle Band
- The Upper Band
- The Lower Band
Together, they form a channel that expands and contracts as market volatility changes.
When price volatility increases, the bands move further apart.
When volatility decreases, the bands move closer together.
This gives traders a visual representation of how active—or quiet—the market currently is.
Bollinger Bands were developed by financial analyst John Bollinger in the early 1980s and have become one of the most widely used indicators across Forex, stocks, commodities, and cryptocurrencies.
Why Are Bollinger Bands Useful?
Financial markets constantly alternate between periods of high and low volatility.
Sometimes prices move aggressively, while at other times they remain relatively quiet.
Bollinger Bands help traders recognise these changing market conditions.
They are useful because they can help traders:
- Measure market volatility
- Identify potential overbought conditions
- Identify potential oversold conditions
- Spot possible breakout opportunities
- Recognise periods of market consolidation
- Confirm trends
- Identify potential reversal areas
Rather than predicting exactly where price will go next, Bollinger Bands provide context about how unusual current price movements may be.
How Do Bollinger Bands Work?
Bollinger Bands are built using two components:
- A moving average
- Standard deviation
Don’t worry if “standard deviation” sounds complicated—it simply measures how much prices are moving away from their average.
The indicator consists of:
The Middle Band
The middle band is usually a 20-period Simple Moving Average (SMA).
It represents the average price over the previous 20 candles.
The Upper Band
The upper band is positioned two standard deviations above the moving average.
As price volatility increases, the upper band moves further away from the middle band.
The Lower Band
The lower band is positioned two standard deviations below the moving average.
Like the upper band, it moves closer or further away depending on market volatility.
Understanding Volatility
One of the biggest strengths of Bollinger Bands is that they automatically adjust to market conditions.
High Volatility
When prices begin making larger movements, the bands widen.
This tells traders that volatility is increasing.
Wide bands often occur during:
- Strong trends
- News events
- Major economic announcements
- Breakouts
Low Volatility
When price movement slows, the bands contract.
This indicates volatility is decreasing.
Narrow bands often occur during:
- Market consolidation
- Sideways trading
- Periods before major breakouts
The ability to measure volatility makes Bollinger Bands unique compared to many other indicators.
What Does It Mean When Price Touches the Bands?
One of the biggest misconceptions among beginners is that price touching the upper or lower band automatically means it will reverse.
This isn’t true.
The bands simply show where price is trading relative to recent volatility.
Price Touches the Upper Band
This indicates that price is relatively high compared to recent market activity.
In a strong uptrend, price may continue riding the upper band for quite some time.
It doesn’t automatically mean the market is overbought.
Price Touches the Lower Band
Similarly, touching the lower band means price is relatively low compared to recent activity.
During strong downtrends, price may remain near the lower band for extended periods.
This doesn’t guarantee an immediate upward reversal.
How Traders Use Bollinger Bands
There are several ways traders use Bollinger Bands in Forex trading.
1. Identifying Market Volatility
This is the simplest use of the indicator.
When the bands widen:
- Volatility is increasing.
- Larger price movements are occurring.
When the bands narrow:
- Volatility is decreasing.
- The market is becoming quieter.
Understanding volatility helps traders decide whether market conditions suit their trading strategy.
2. The Bollinger Band Squeeze
One of the most well-known Bollinger Band patterns is called the Bollinger Band Squeeze.
A squeeze occurs when the upper and lower bands move unusually close together.
This indicates that volatility has become very low.
Periods of low volatility are often followed by periods of high volatility.
As a result, many traders watch for a breakout after a squeeze.
However, the squeeze itself does not indicate which direction the breakout will occur.
Confirmation from price action is essential.
3. Trading Trend Pullbacks
In trending markets, Bollinger Bands can help identify potential pullback opportunities.
During an Uptrend
Price often returns toward the middle band before continuing higher.
Some traders view these pullbacks as possible buying opportunities if bullish price action appears.
During a Downtrend
Price may rally back towards the middle band before resuming its decline.
Bearish confirmation can provide potential selling opportunities.
The middle band often acts as dynamic support or resistance during established trends.
4. Identifying Potential Reversals
In ranging markets, traders sometimes look for reversal opportunities.
For example:
- Price reaches the upper band.
- A bearish candlestick pattern appears.
- RSI shows overbought conditions.
These combined signals may suggest a potential downward reversal.
Likewise:
- Price reaches the lower band.
- A bullish candlestick pattern forms.
- RSI indicates oversold conditions.
This combination may suggest a potential upward reversal.
Using multiple forms of confirmation reduces the likelihood of false signals.
A Simple Beginner Bollinger Band Strategy
A straightforward way to use Bollinger Bands is to combine them with price action.
Buy Setup
- Price touches or briefly moves below the lower band.
- A bullish candlestick pattern forms.
- RSI begins rising from oversold conditions.
- Consider a buy trade if other technical factors support the setup.
Sell Setup
- Price touches or briefly moves above the upper band.
- A bearish candlestick pattern appears.
- RSI begins falling from overbought conditions.
- Consider a sell trade if additional confirmation supports the trade.
Waiting for confirmation helps avoid entering trades simply because price has reached one of the bands.
Common Bollinger Band Settings
Most trading platforms use the following default settings:
- 20-period Simple Moving Average
- 2 Standard Deviations
These settings work well for most Forex traders and are generally recommended for beginners.
Some experienced traders adjust these values depending on their trading style, but the default settings remain the most widely used.
Advantages of Bollinger Bands
Bollinger Bands have remained popular for decades because they offer several benefits.
They are:
- Easy to understand
- Suitable for beginners
- Excellent for measuring market volatility
- Useful in both trending and ranging markets
- Helpful for identifying potential breakout opportunities
- Adapt automatically to changing market conditions
- Compatible with all Forex currency pairs
- Effective across multiple timeframes
Their flexibility makes them one of the most versatile indicators available.
Limitations of Bollinger Bands
Despite their usefulness, Bollinger Bands are not perfect.
One common mistake beginners make is assuming that price touching a band automatically signals a reversal.
In reality, strong trends can keep price near the upper or lower band for long periods.
Other limitations include:
- False reversal signals during strong trends
- Breakouts can occasionally fail after a Bollinger Band squeeze
- The indicator cannot predict the direction of future price movement
- Best results usually require confirmation from other indicators or price action
Like all technical indicators, Bollinger Bands should be viewed as one part of a complete trading strategy.
Tips for Beginners
If you’re new to Bollinger Bands, consider these tips:
- Start with the default settings (20, 2).
- Don’t assume every touch of the upper or lower band is a trading signal.
- Always wait for confirmation from price action or another indicator.
- Learn to recognise the difference between trending and ranging markets.
- Practice using Bollinger Bands on a demo account before trading with real money.
Patience is often rewarded when using this indicator.
Bollinger Bands vs. Moving Averages
Although Bollinger Bands include a moving average, they provide much more information than a moving average alone.
A moving average primarily shows the direction of the trend.
Bollinger Bands add an important extra layer by showing how volatile the market is.
This allows traders to judge whether current price movements are relatively large or relatively small compared to recent market activity.
Many traders use moving averages to identify the trend and Bollinger Bands to help time their entries and exits.
Conclusion
Bollinger Bands are one of the most versatile and widely used indicators in Forex trading. By combining a moving average with measures of market volatility, they help traders identify changing market conditions, recognise potential breakout opportunities, and spot areas where price may be becoming overextended.
For beginners, Bollinger Bands provide an excellent introduction to volatility analysis because they are easy to interpret and available on virtually every trading platform. Whether you’re using them to identify periods of low volatility before a breakout, measure the strength of a trend, or find potential reversal zones, they can become a valuable part of your technical analysis toolkit.
However, like all trading indicators, Bollinger Bands should not be relied upon in isolation. Combining them with price action, support and resistance levels, momentum indicators such as the RSI, and sound risk management practices can help you make more informed and disciplined trading decisions. When used as part of a well-rounded Forex trading strategy, Bollinger Bands can provide valuable insight into both market volatility and potential trading opportunities.
Leave a Reply
You must be logged in to post a comment.